LumaClaims
Medicare Claims Analytics Platform
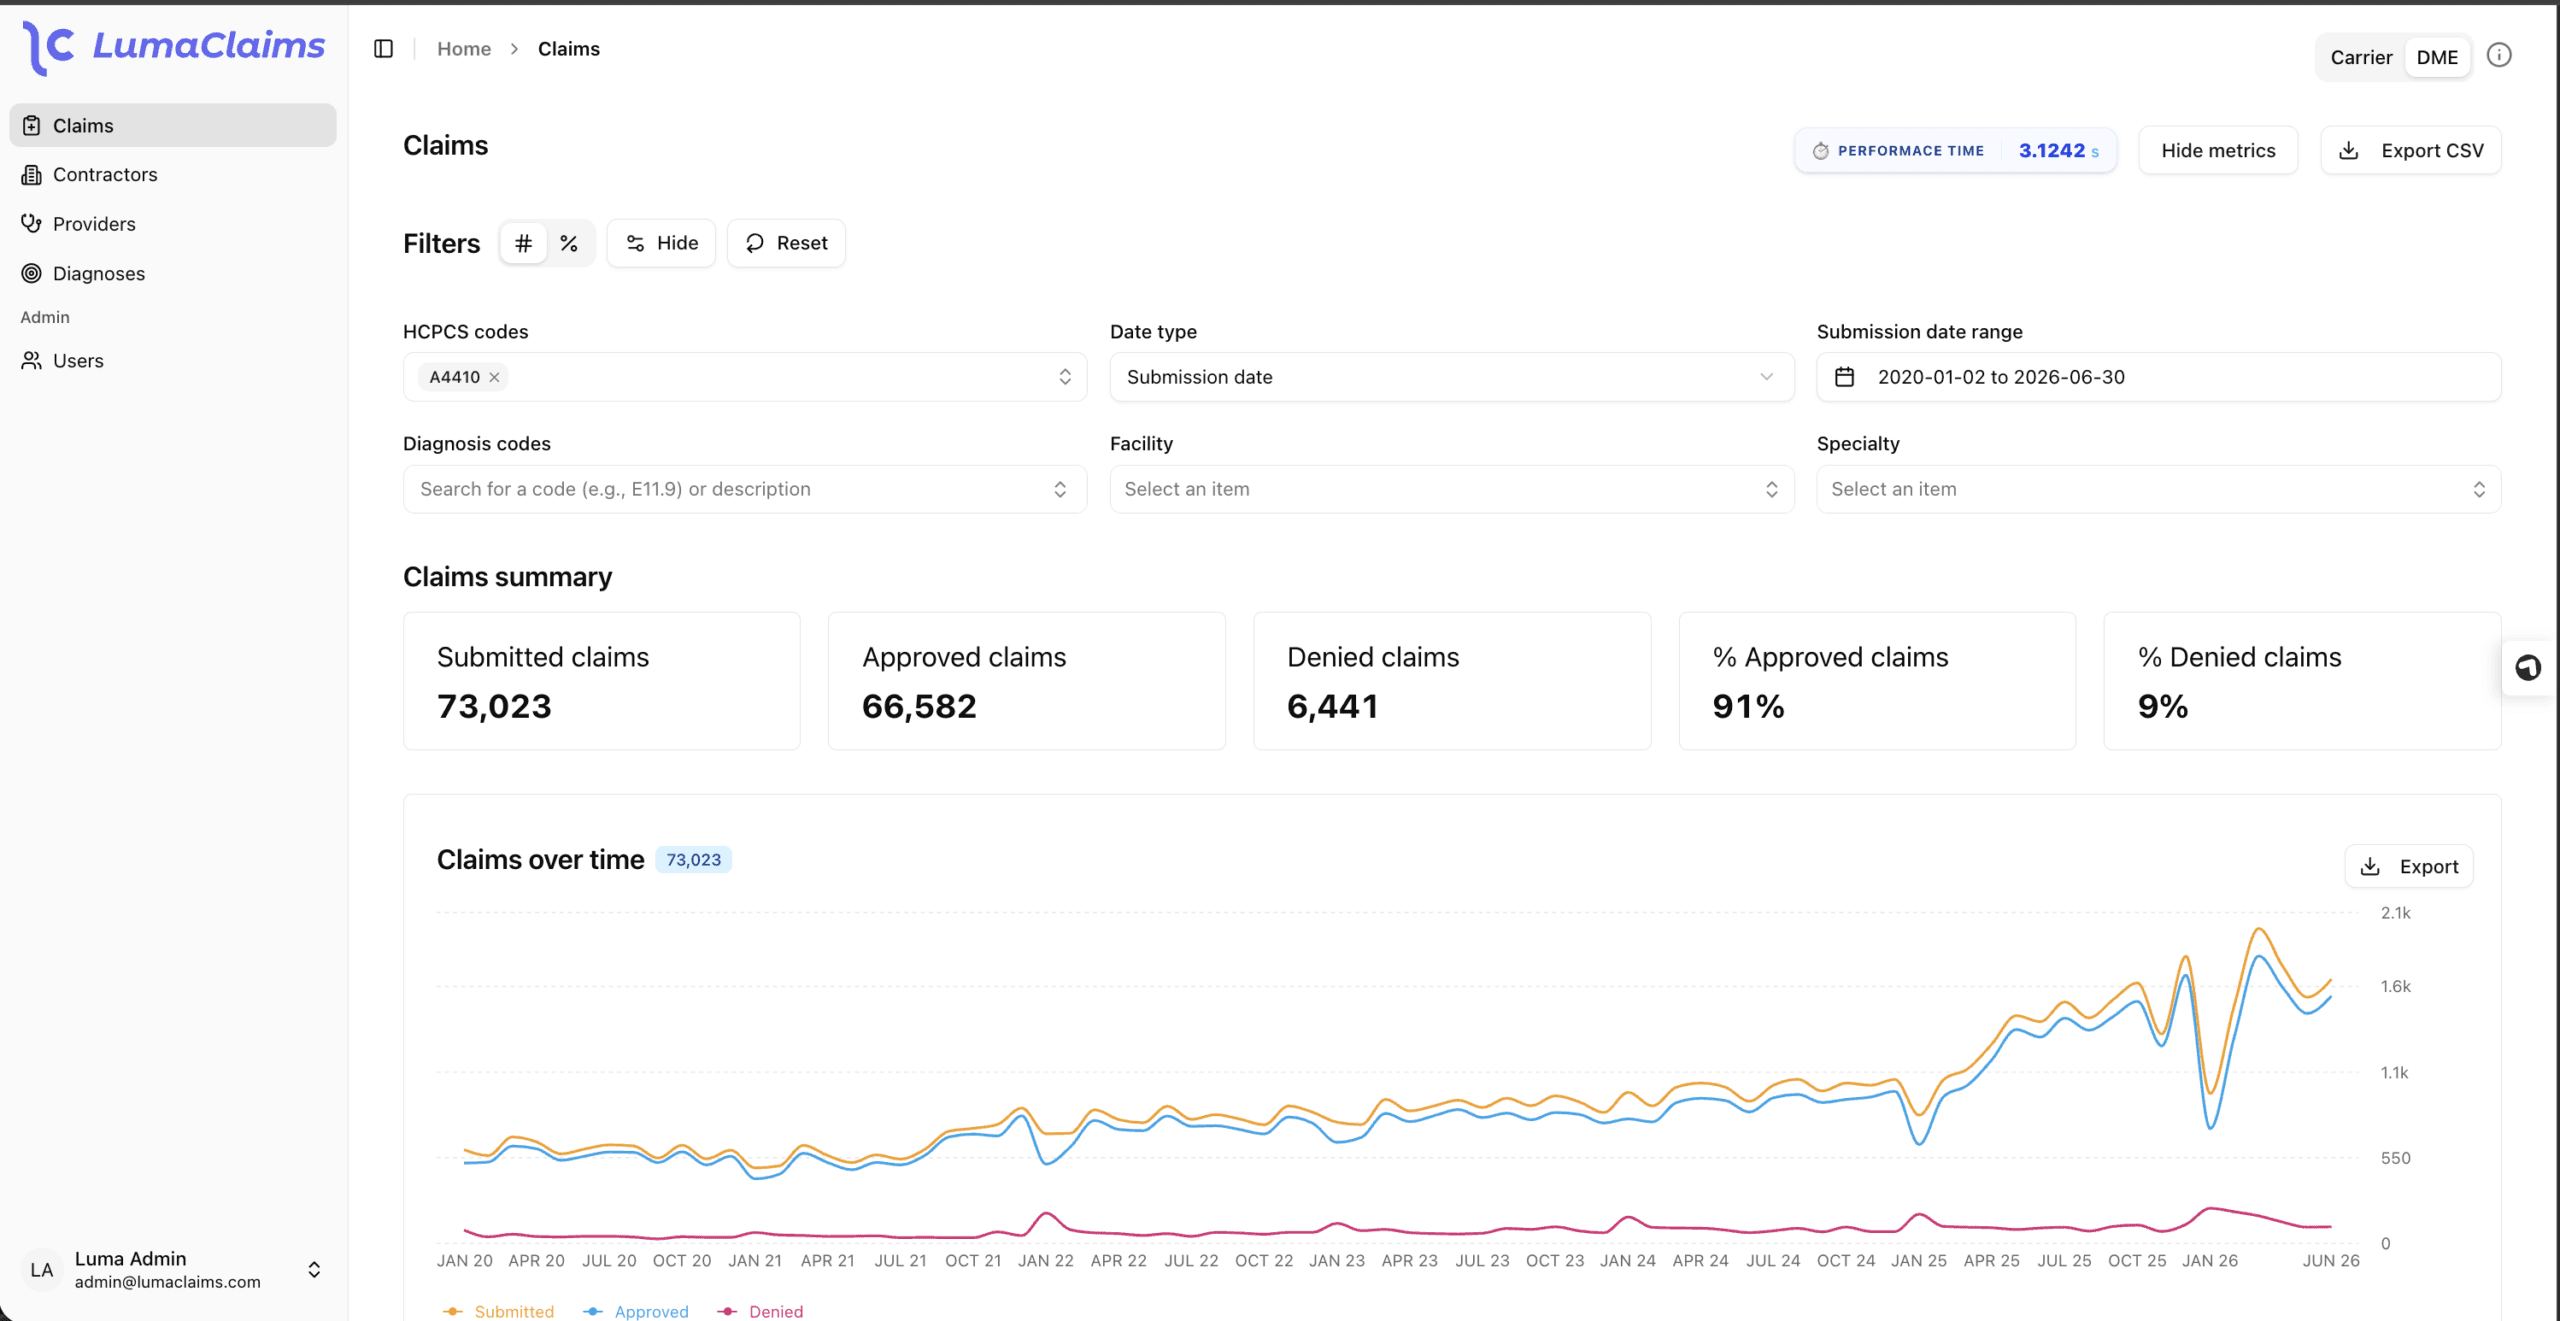


Turning Claims Data into Useful Insights
From Complex Datasets to Interactive Analysis
Large Data, Difficult Exploration
A Connected Analytics Platform

Claims Data at Scale
Organize high-volume Medicare Part B data for repeated analysis, with a cloud foundation suited to large analytical workloads.

Interactive Dashboards
Give users filters, charts and reporting views that help them explore questions without writing their own database queries.

Updated Reporting Periods
Support newly available claims data while keeping reporting periods and analytical context clear.

Controlled Product Access
Provide an application access flow that connects users to the dashboards and views available within the product.
Client Requirements

Engineering Challenges

High-Volume Analysis
Queries across a large claims dataset need to return useful results without treating every dashboard interaction as an unrestricted scan of raw records.

Consistent Data Models
Claims and reference data need compatible definitions so filters, comparisons and reporting views remain consistent.

Query Performance and Cost
Dashboard interactions need practical query patterns that account for the amount of data processed and the cost of repeated analysis.

Clear Visual Reporting
Complex measures and dimensions need to be presented through charts and views that users can interpret in context.

Evolving Product Requirements
The product needed room for additional views and datasets. Phased delivery allowed the client to review working features and refine subsequent priorities.
Product Needs Behind the Build
“Data Freshness Matters”
Analysts need to understand which reporting periods are available before drawing conclusions from claims activity.

“Raw Records Need Context”
Data becomes more useful when users can connect measures to clear dimensions and definitions.

“Questions Change During Analysis”
Interactive filters let users refine a question as they explore, rather than relying entirely on a predefined report.

“Consistency Supports Confidence”
Repeatable data preparation and aligned reporting definitions help users compare results with greater clarity.

The Macromodule Solution
-
Overview Dashboards Present key measures and charts through a common reporting interface.
-
Interactive Filtering Help users narrow the available data around their analytical questions.
-
Detailed Exploration Connect overview information to more focused reporting views.
-
Reference Data Integration Bring supporting datasets into the analytical experience.
-
Phased Product Delivery Release working features for client review before extending the next set of capabilities.

Data and Application Architecture
Claims Data Foundation

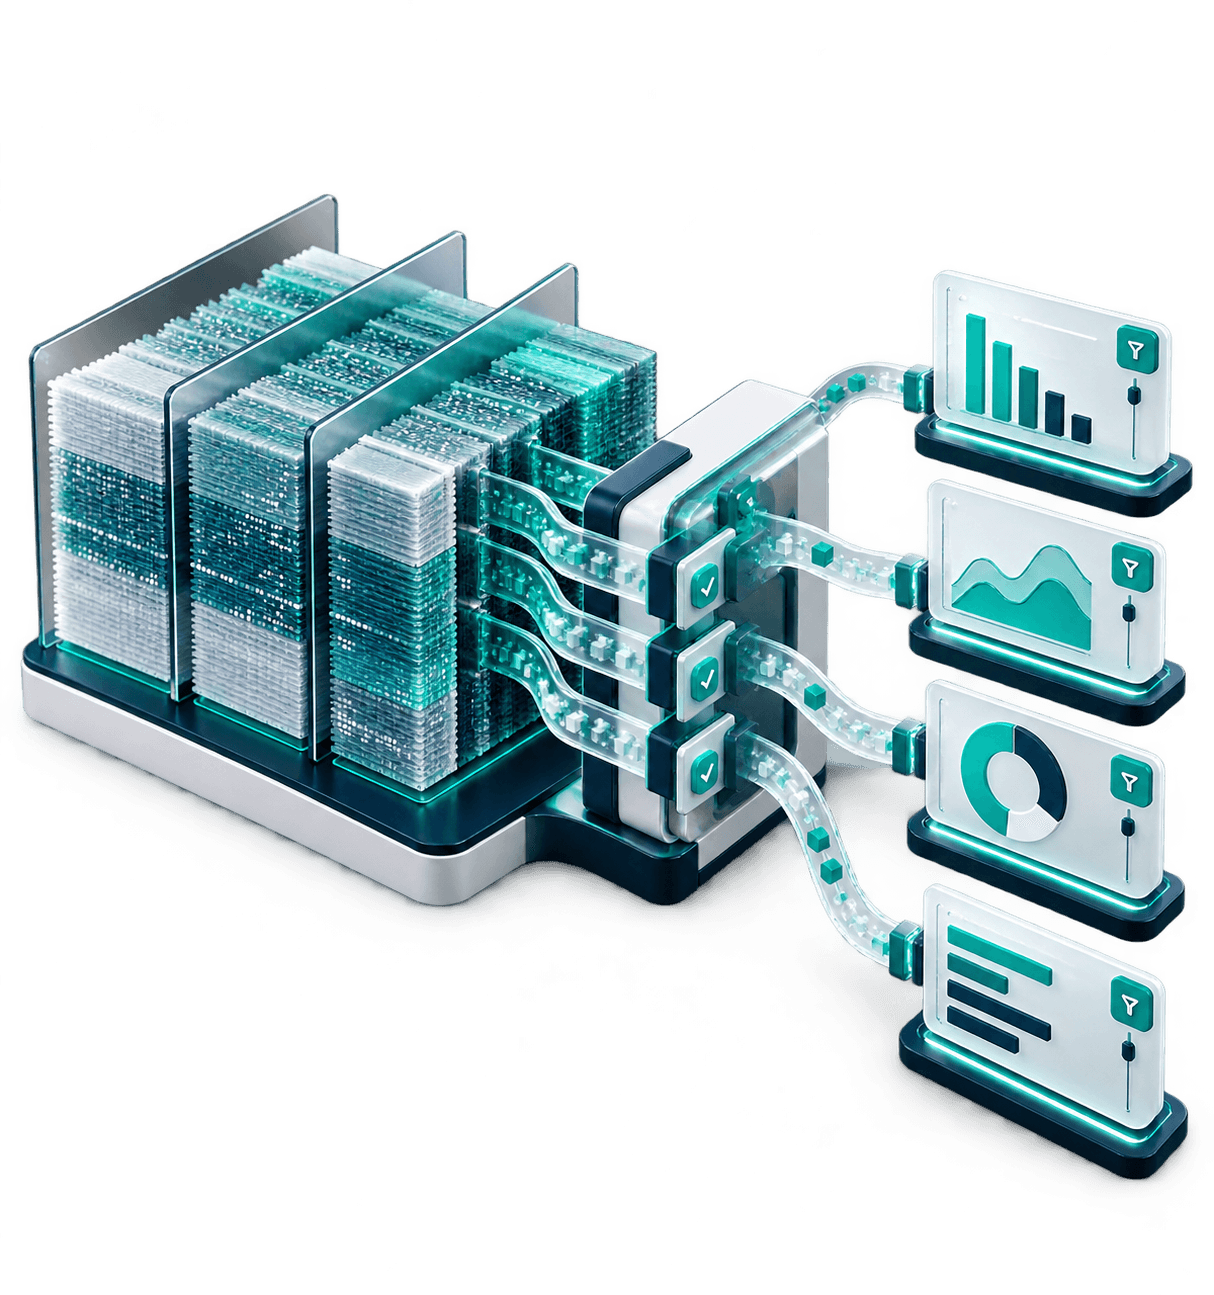
Organizes source claims and supporting datasets for use in the platform’s reporting workflows.
BigQuery Analytics
Provides the analytical foundation for filtered queries and the results displayed in reporting views.
Application Services

Connects product access, query inputs, and analytical results to the application's dashboard functionality.
Interactive Reporting

Presents filters, charts, and detailed views that help users explore the data through a web interface.
Data Update Workflow

Supports preparing and loading newly available source data for subsequent reporting periods.
Engineering and Delivery Approach

Data Modeling
Connect source and reference data to the dimensions, filters and measures needed by the dashboard.

Query Development
Build analytical queries around practical reporting questions and the information each view needs to display.

Phased Releases
Deliver access flows, overview dashboards, and detailed reporting capabilities in reviewable milestones.

Client Validation
Review working features with the client and use feedback to refine the next delivery phase.
Analytics Experience and Access

Product Access
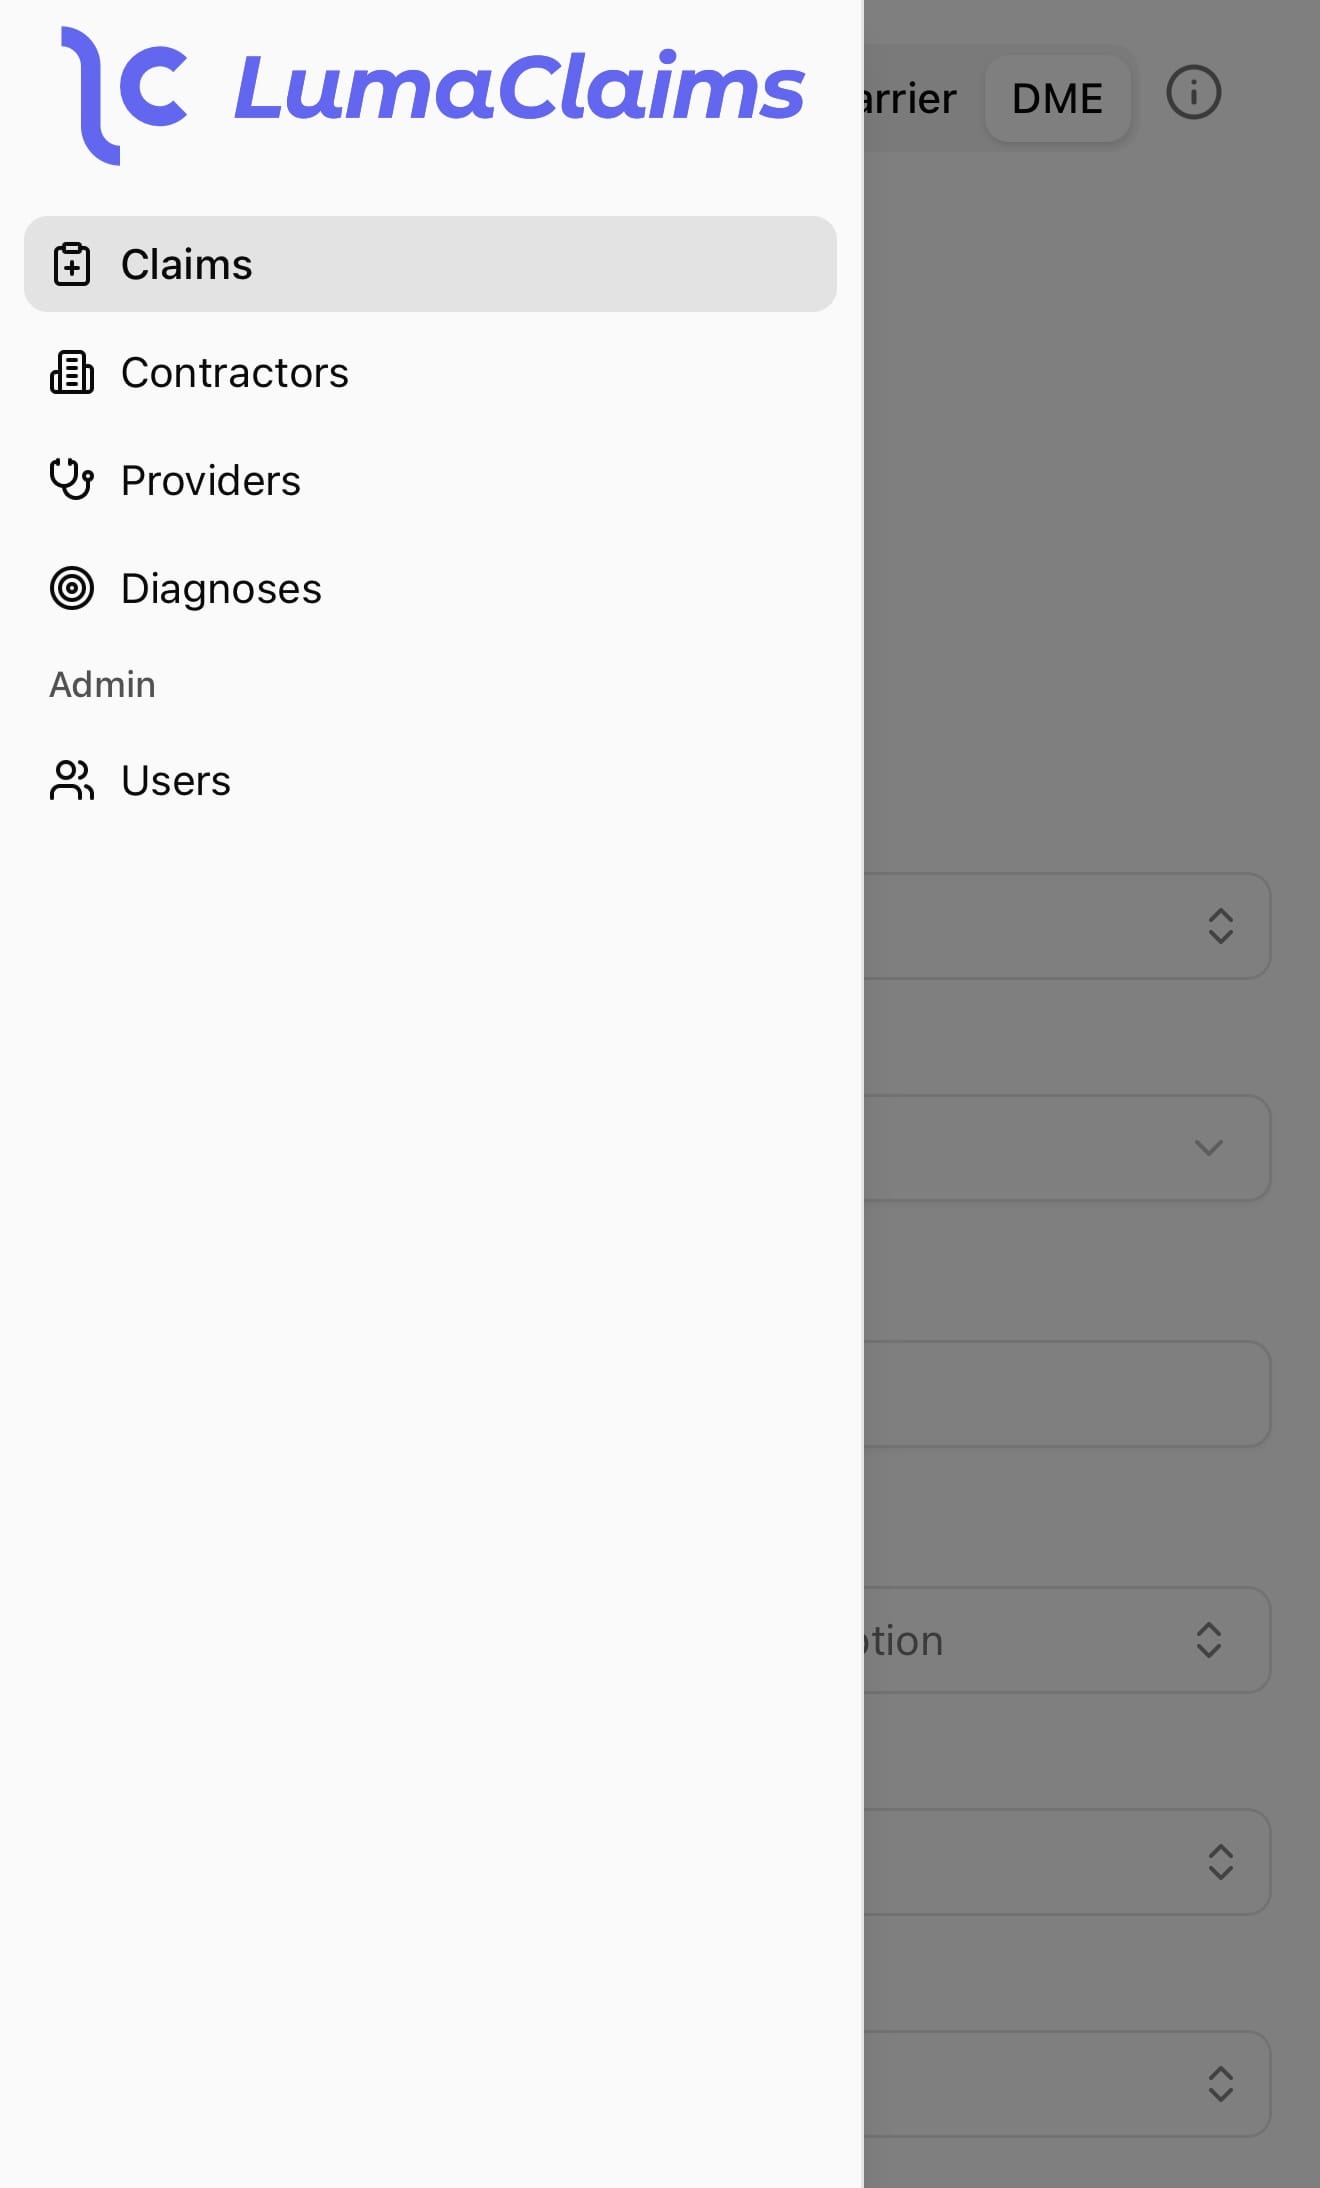
LAYER // 01Users enter through the application’s access flow before working with the available dashboards.

Filterable Views
LAYER // 02Filters and visualizations help users move from a broad overview to a more focused analytical question.

Reporting Context
LAYER // 03Data periods and relevant dimensions give users context for interpreting the results they see.

Frequently Asked Questions

Working Web Analytics Product
The client received a browser-based platform for exploring claims data through dashboards and reporting views.

Cloud Analytical Foundation
BigQuery connects large-scale analytical workloads to the application experience.

Interactive Data Exploration
Users can investigate questions through filters and visualizations rather than handling raw source records directly.

Reviewable Delivery Milestones
Phased releases gave the client working features to assess as the platform developed.

A Foundation for Further Development
The product structure supports subsequent datasets, reporting views, and improvements to the analytical experience.
Engineering Capabilities Demonstrated

Healthcare Data Engineering
Organizing complex claims and reference data around useful reporting requirements.

BigQuery Analytics Development
Connecting analytical queries and reporting results to an application users can navigate.
Interactive Dashboard Engineering
Building filters, charts, and exploration paths around real product questions.

Collaborative Product Delivery
Turning client feedback and phased milestones into continued product development.
Build Your Data Platform with Macromodule
Our data engineering services connect data preparation, cloud analytics, and product interfaces around your reporting needs.

Healthcare Analytics Platforms
Develop reporting products around healthcare datasets, clear definitions, and the questions your users need to answer.
Cloud Data Warehouses
Organize data from multiple sources into an analytical foundation for reporting and product development.

Interactive Reporting Dashboards
Build filterable views and visualizations that help users explore and compare information.

Data Pipelines and Integrations
Connect source data, preparation workflows, and application services into a maintainable data platform.
Frequently Asked Questions
Let's Build Your Next Digital Product
Whether you are launching a new platform, modernizing legacy systems, or expanding engineering capacity, Macromodule Technologies helps you move forward with clarity and confidence. We support you across product discovery, technical architecture, UI/UX design, software development, quality assurance, cloud deployment, and continuous improvement. By understanding your core business goals early, we define a clear, risk-free delivery roadmap before writing a single line of code.
From AI-powered platforms and custom enterprise software to blockchain systems, mobile applications, cloud infrastructure, and data-intensive products, we engineer secure, scalable solutions built around your operational strategy. Our focus isn't just on launching—we build a flexible technical foundation that evolves as your users, data, and business requirements grow.
Partner with an engineering team that takes complete ownership, communicates transparently, and stays laser-focused on delivering measurable, long-term value.
Our Offices:

Head Office (USA)
Address: 28 W Flagler St Ste 300B #324 Miami, FL 33130
Phone: +1 (321) 364-6867
Email: consultant@macromodule.com

Regional Office (UAE)
Address: Business Centre, Sharjah, United Arab Emirates
Phone: +971 55 154 7284
Email: consultant@macromodule.com

Innovation Hub (Pakistan)
Address: 61 C, Pia Housing Scheme, Lahore 54000
Phone: +92 (339) 0134700
Email: consultant@macromodule.com
